Data Analytics · BI Dashboards · Reporting

Hi, I'm Aleeya.

I'm a Data Science and Information Science graduate from the University of Wisconsin-Madison with experience building dashboards, validating large datasets, tracking KPIs, and translating business and product data into clear insights.

I enjoy turning complex data into practical reports, reliable workflows, and decision-ready analysis for technical and nontechnical audiences.

Skills

Tools and areas I use across analytics, dashboarding, automation, reporting, and data validation.

Excel PivotTables V/XLOOKUP Power Query Power BI Tableau DAX SQL Python Pandas NumPy R MySQL MongoDB SQL Server Firebase Google Analytics Looker APIs GitHub QGIS n8n Lark Sheets

Experience

Jun 2026 — Present

Data Science & Product Analyst · Vespid

  • Build and monitor Firebase and Google Analytics dashboards tracking monthly active users, new users, screen views, engagement events, and notification activity to support product performance reporting.
  • Analyze 30-day and 7-day active user activity to identify engagement, retention, and product usage trends.
  • Review event-level behavior across core app flows, including flashcard starts, flashcard completions, and quiz starts, to evaluate feature usage and engagement drop-off.
  • Monitor app stability and engagement metrics, including crash-free users and average engagement time, to support release tracking.
Jul 2025 — Feb 2026

Data Curator and Analyst · Interlinked

  • Used Python and Pandas to perform QA checks on a 3.05M-row wildfire ignition dataset, validating records, feature IDs, coordinate fields, timestamps, CRS, and metadata.
  • Verified 25 years of ignition records from MODIS/VIIRS sources to support wildfire model input reliability.
  • Developed repeatable EDA and data-quality checks to reduce manual review effort while identifying anomalies, missing values, coordinate issues, and metadata concerns.
  • Created 100 km × 100 km QGIS spatial analysis windows across California to support regional wildfire modeling workflows.
Jun 2025 — Aug 2025

Data Science Intern · LeyLine Technologies

  • Built a website chatbot MVP using React for the frontend and Python backend APIs to process chatbot messages, store structured conversation logs, and make user interactions easier to review and analyze.
  • Created logging workflows that turned raw chatbot activity into organized datasets in Lark Sheets for monitoring user behavior and product performance.
  • Designed n8n automation pipelines using platform-specific APIs to extract, transform, and load data for automated postings from Google Sheets, improving operational efficiency.
  • Added data validation and fallback logic to reduce errors and keep chatbot data consistent.
  • Worked with team members to document data workflows and progress reports for easier review and maintenance.

Projects

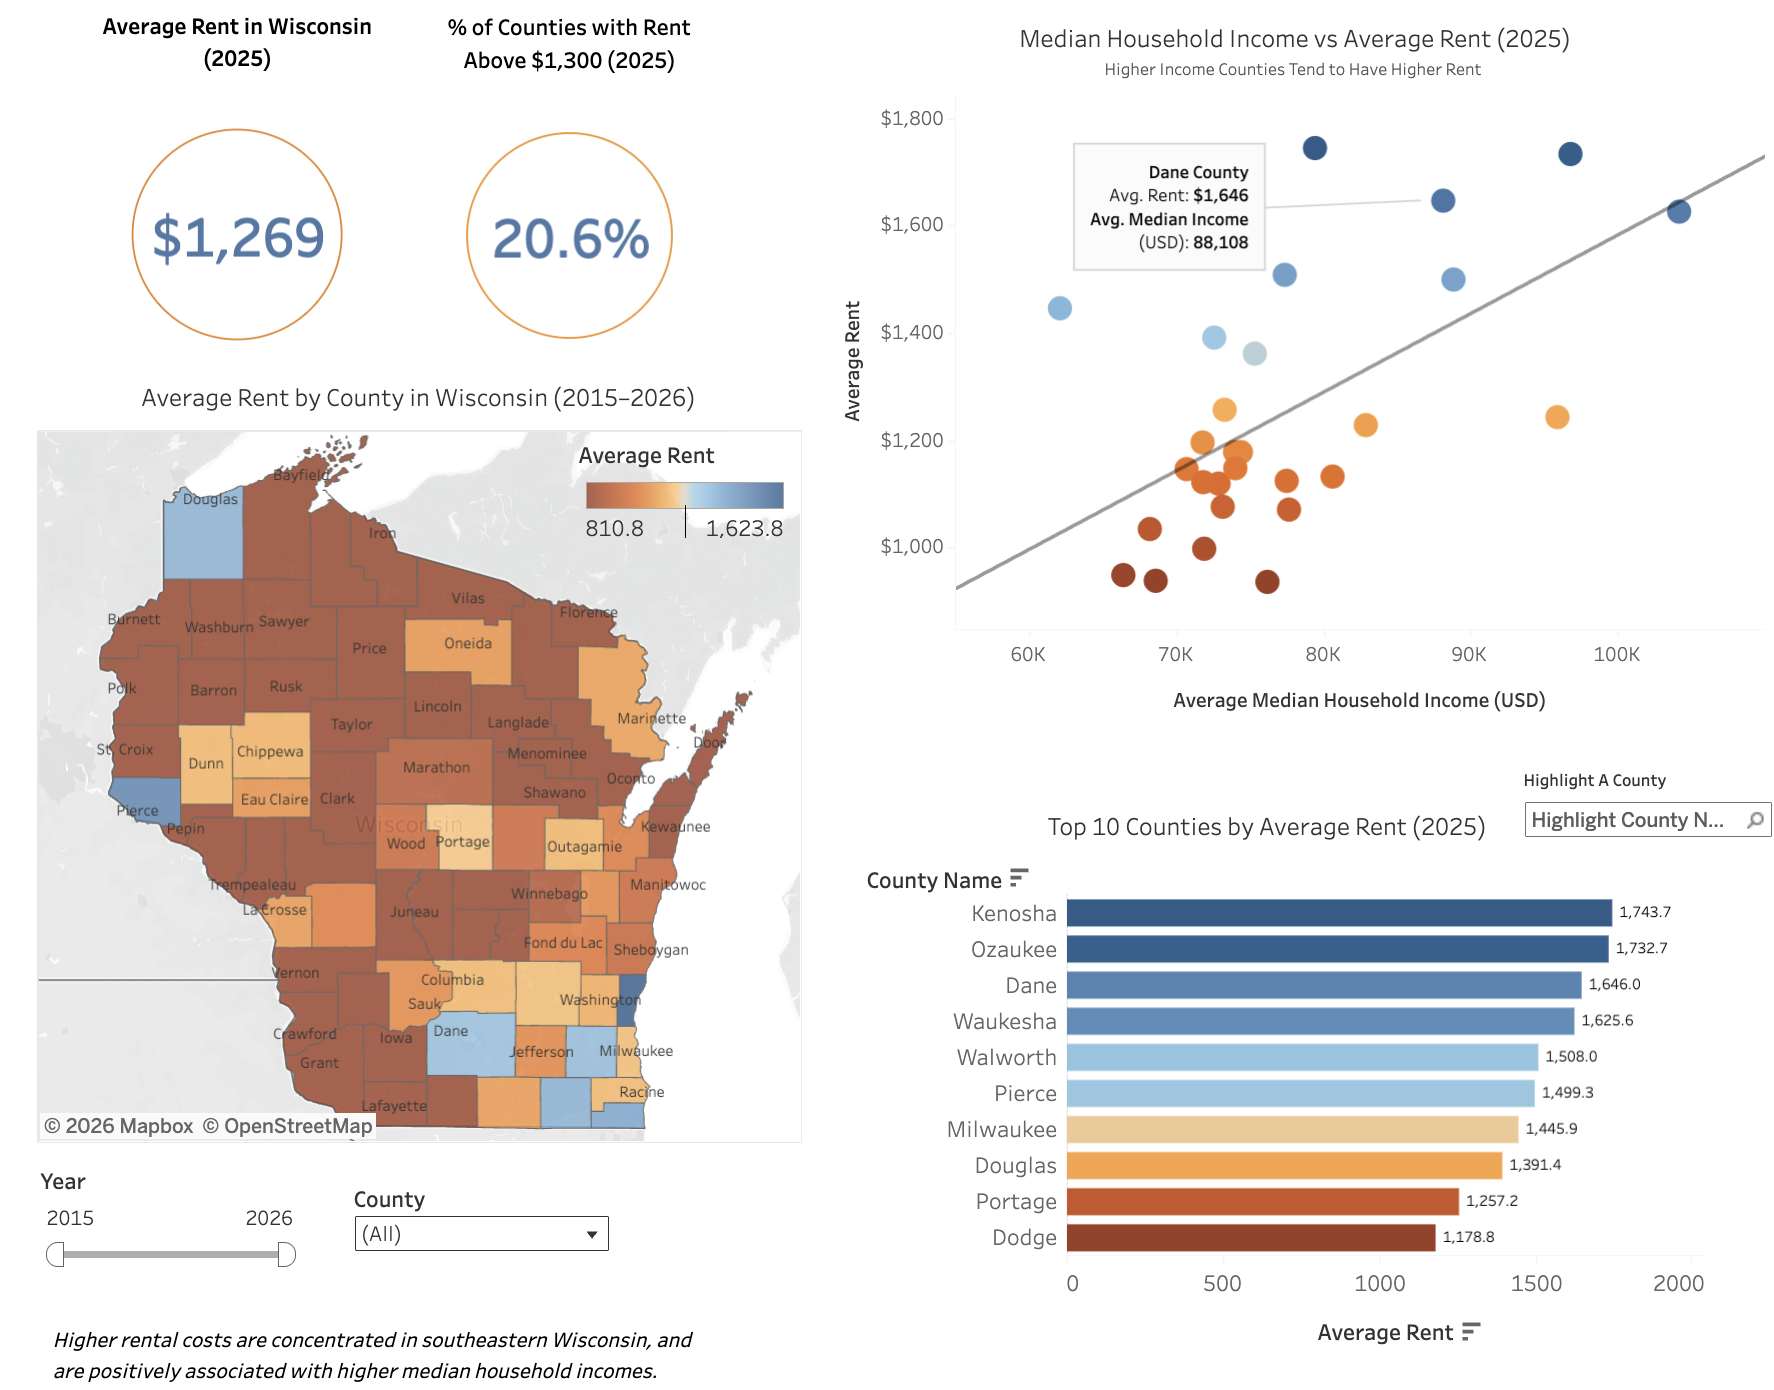
Screenshot of Tableau Housing dashboard

Tableau · Policy analytics

Wisconsin Housing Inequality Dashboard & Policy Brief

Analyzed Wisconsin county-level rent and affordability trends using Zillow ZORI, ACS income, and county boundary data, then translated the findings into a Tableau dashboard and policy brief.

Tableau ACS Data Zillow ZORI Maps Policy Brief
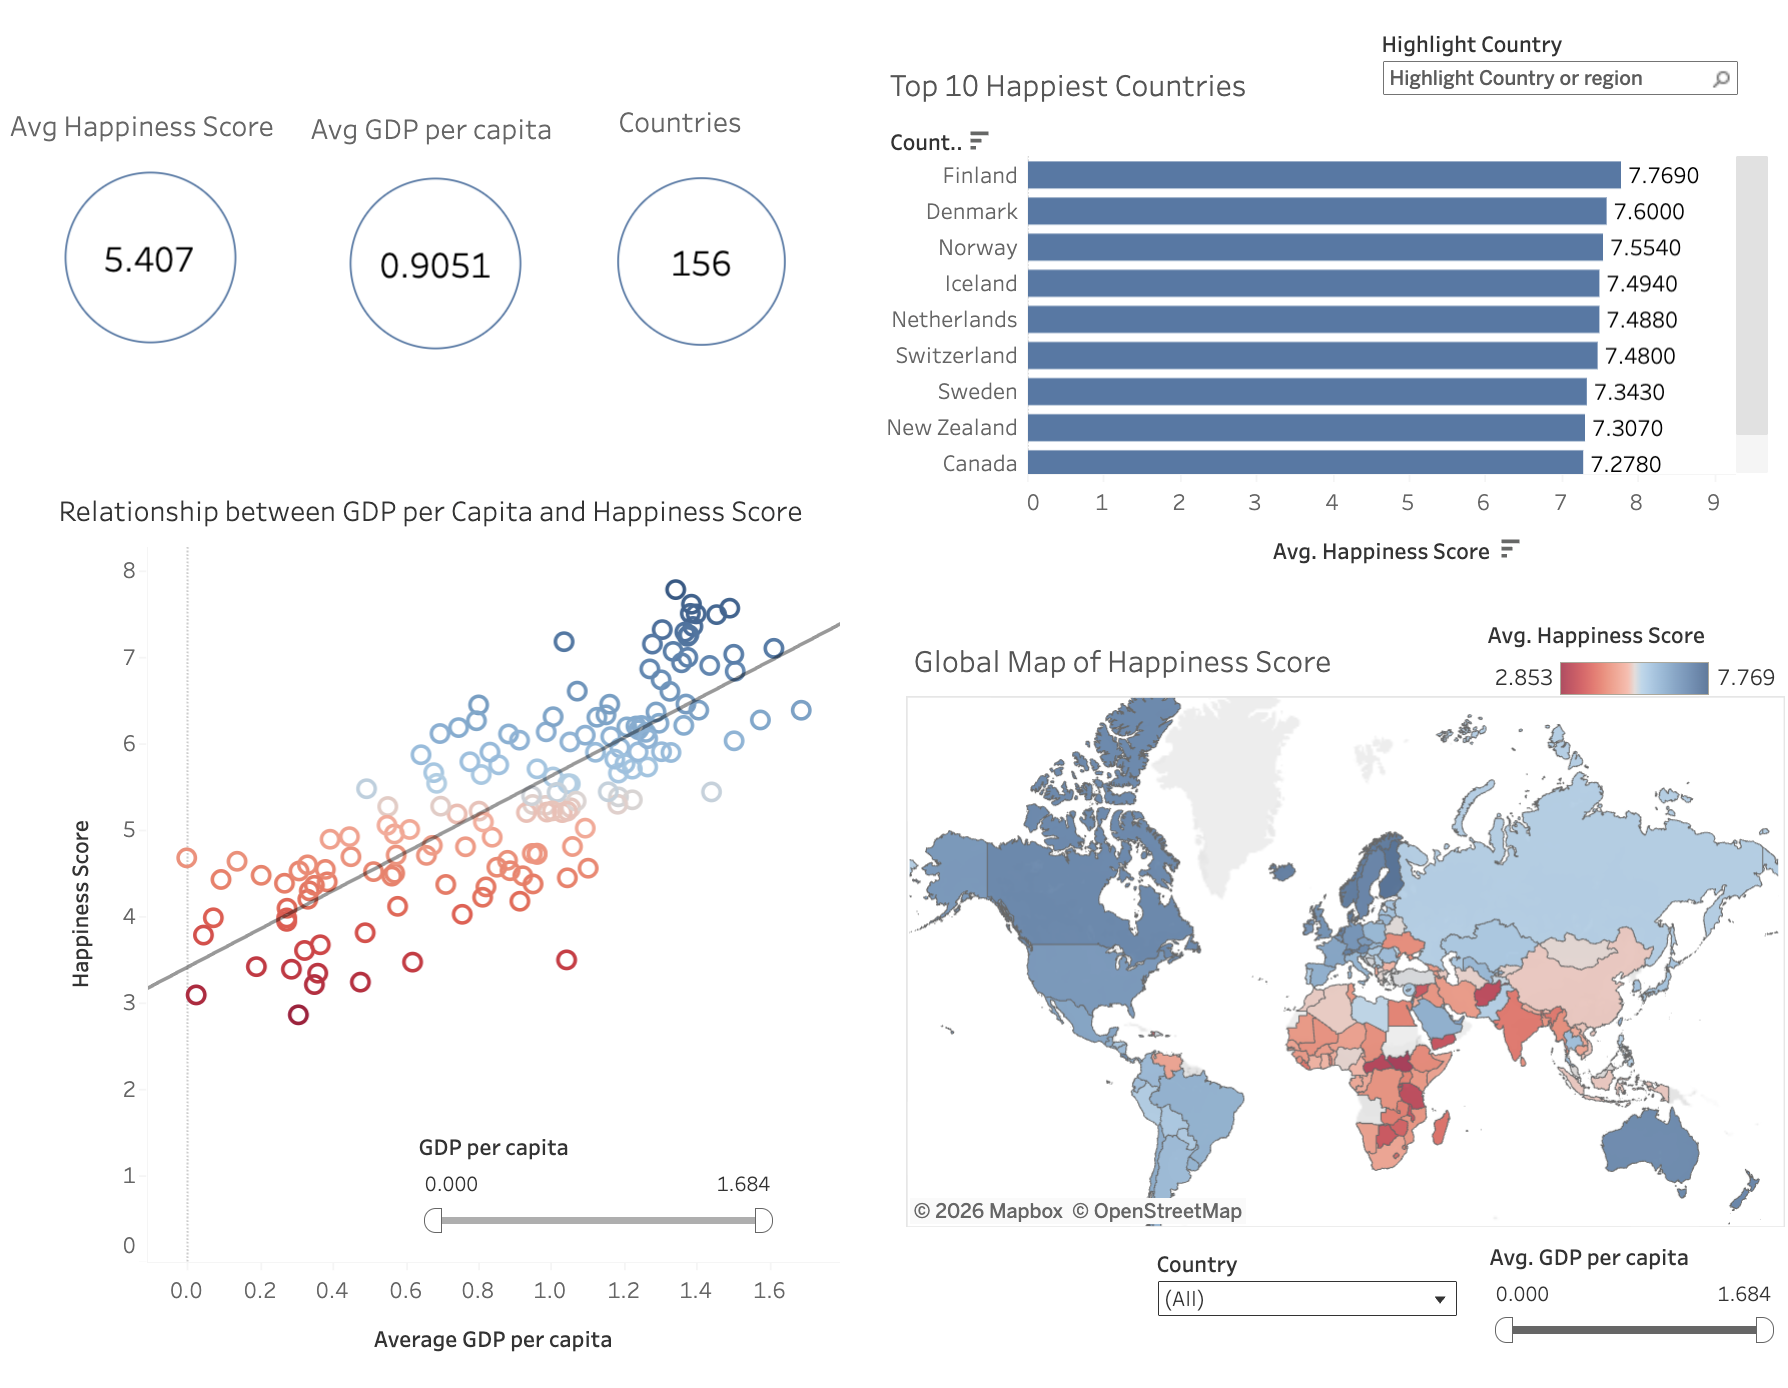
Screenshot of Tableau Happiness dashboard

Tableau · Global analysis

Global Happiness Analysis Dashboard

Built an interactive Tableau dashboard analyzing global happiness scores across 150+ countries using GDP, regional, and demographic data to explore country-level patterns and key drivers.

Tableau KPI Cards Maps Scatterplots Data Storytelling
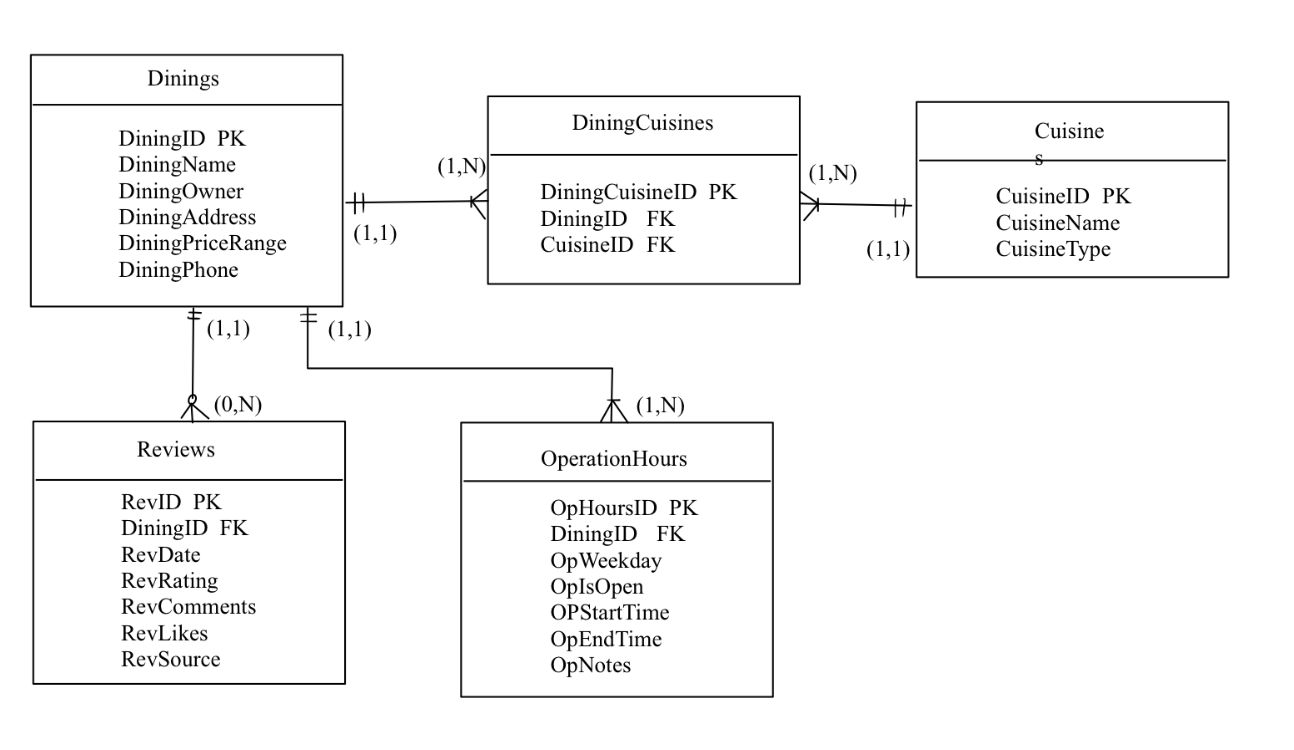
Screenshot of Dining ERD

Database design · SQL / NoSQL

Wisconsin Dining Relational Database System

Designed a relational dining database with restaurant, review, cuisine, and operating-hour records, wrote SQL queries for analysis, and adapted the relational structure into MongoDB documents.

MySQL MongoDB ERD SQL Joins Constraints
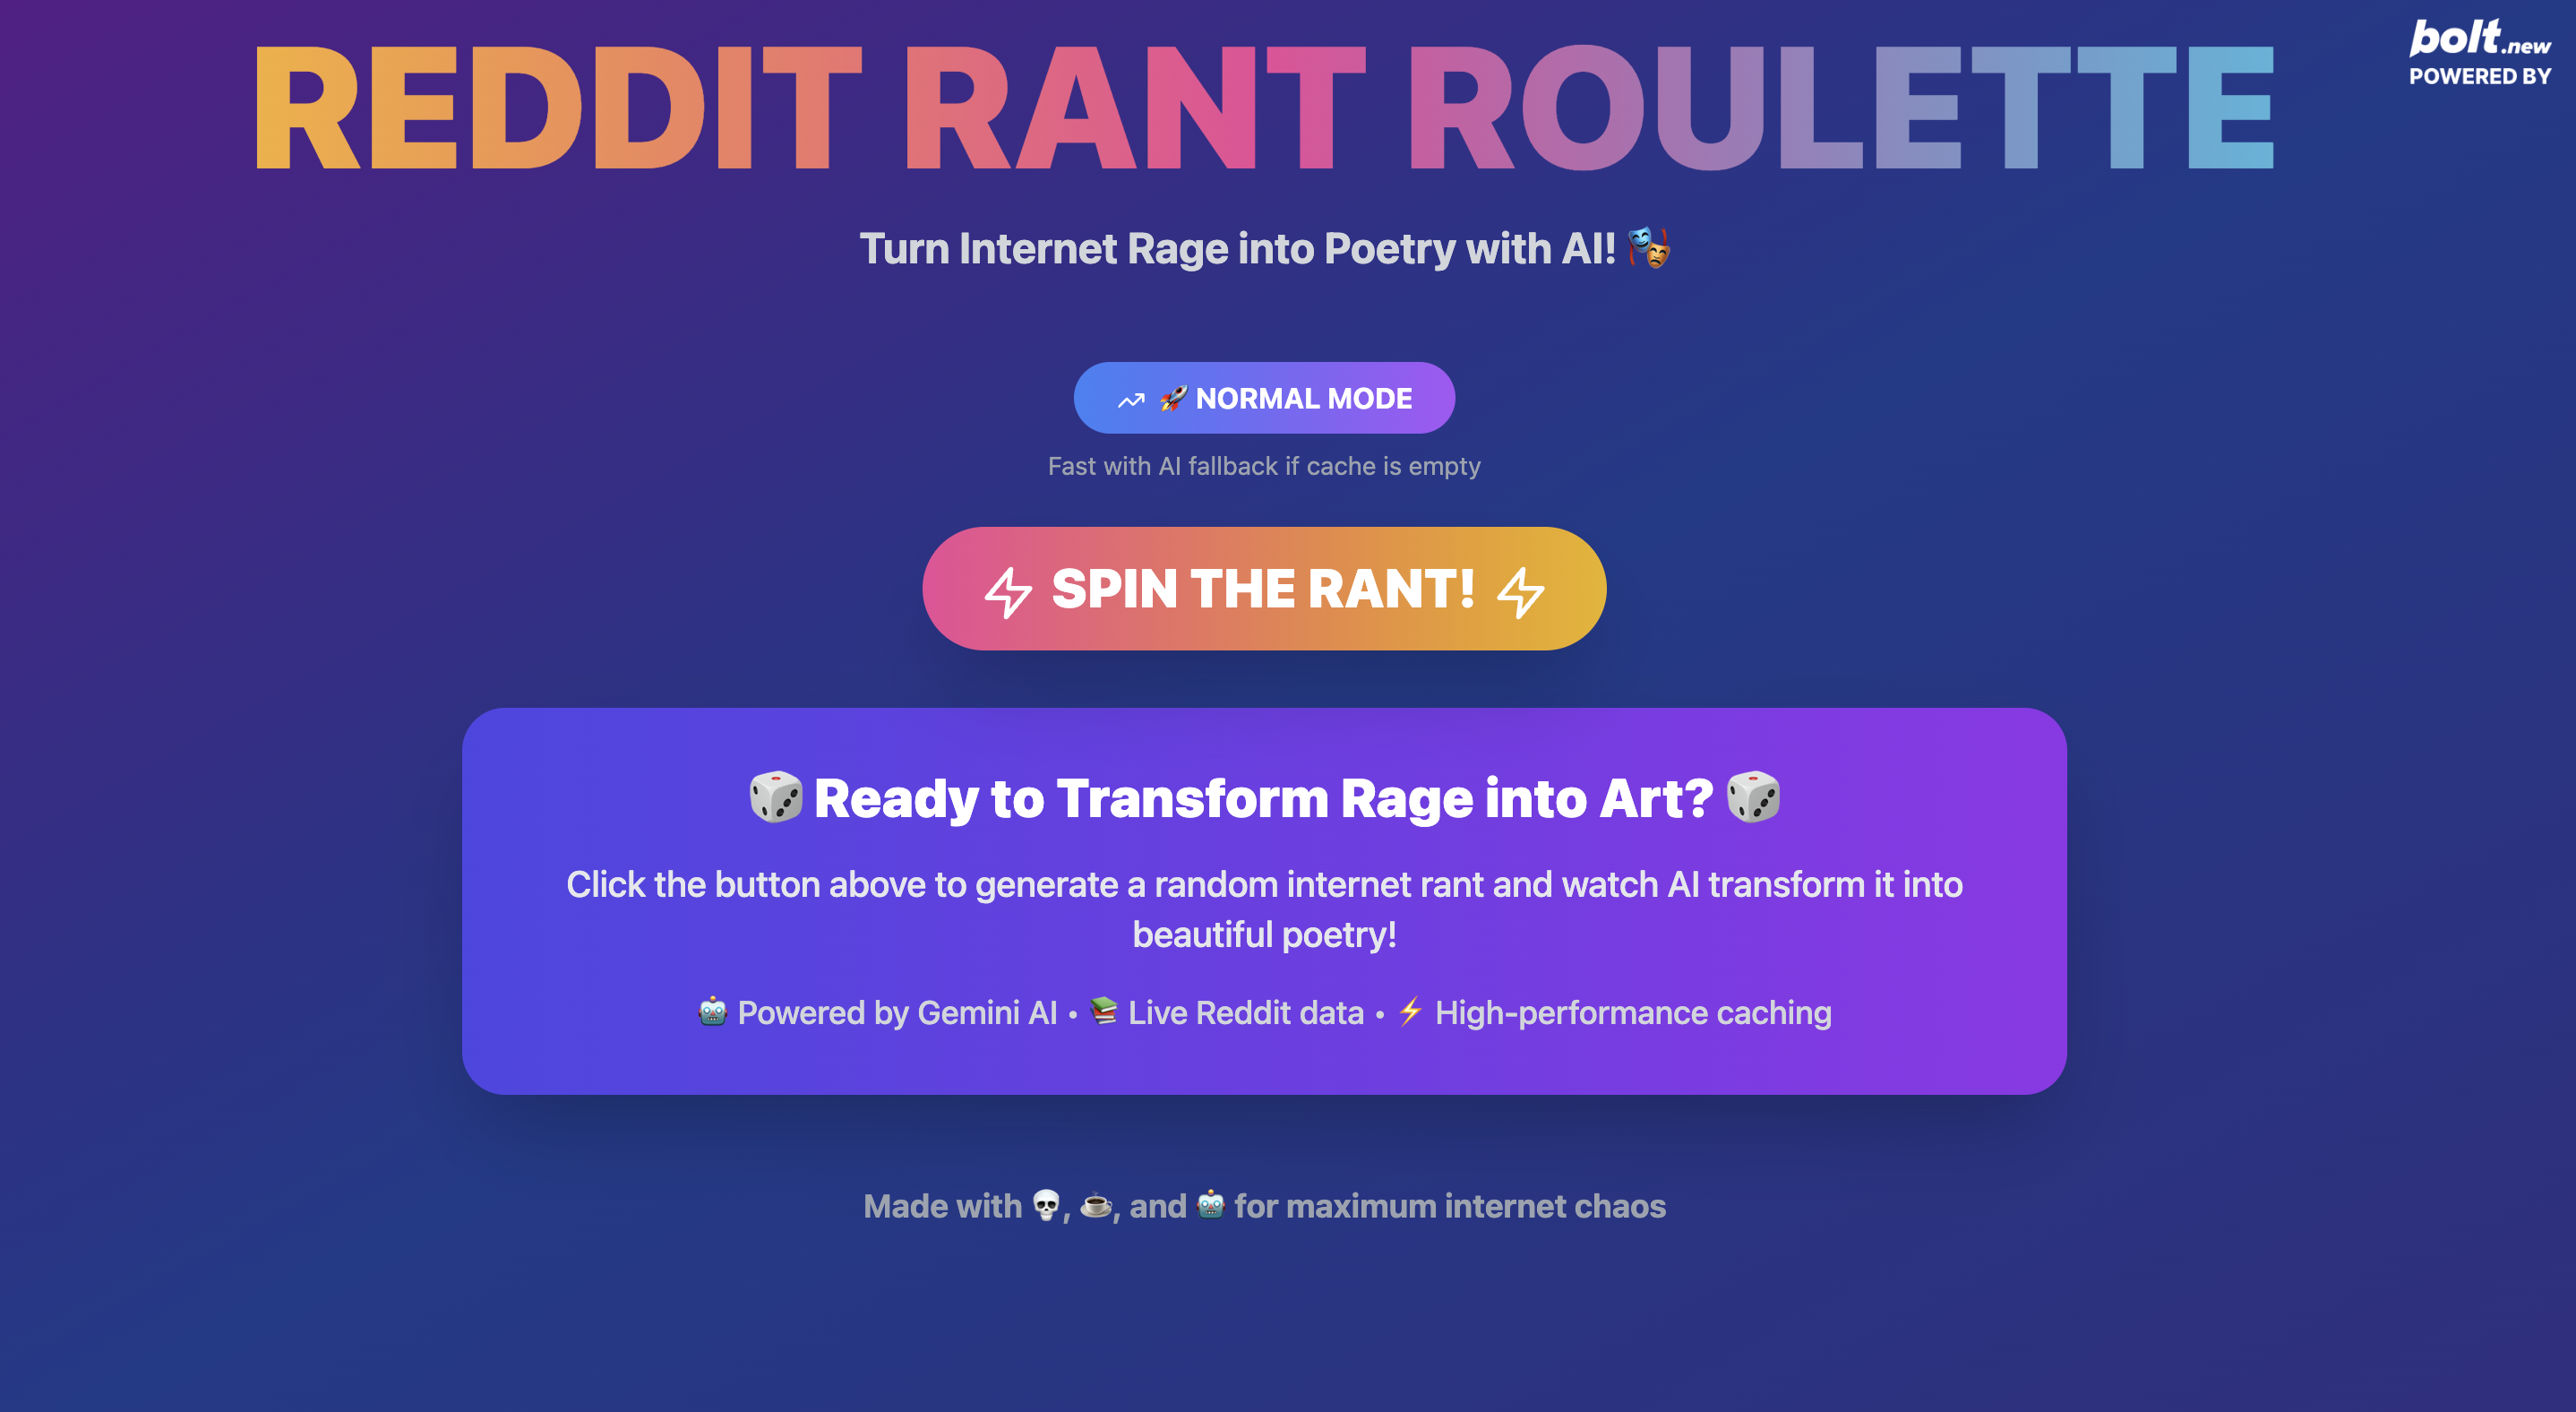
Screenshot of Reddit Rant Roulette

Full-stack AI app

Reddit Rant Roulette

Built a full-stack AI web app that turns Reddit rants into poems using a custom scraper, Gemini API, Flask backend, and React frontend.

React Flask Gemini Netlify
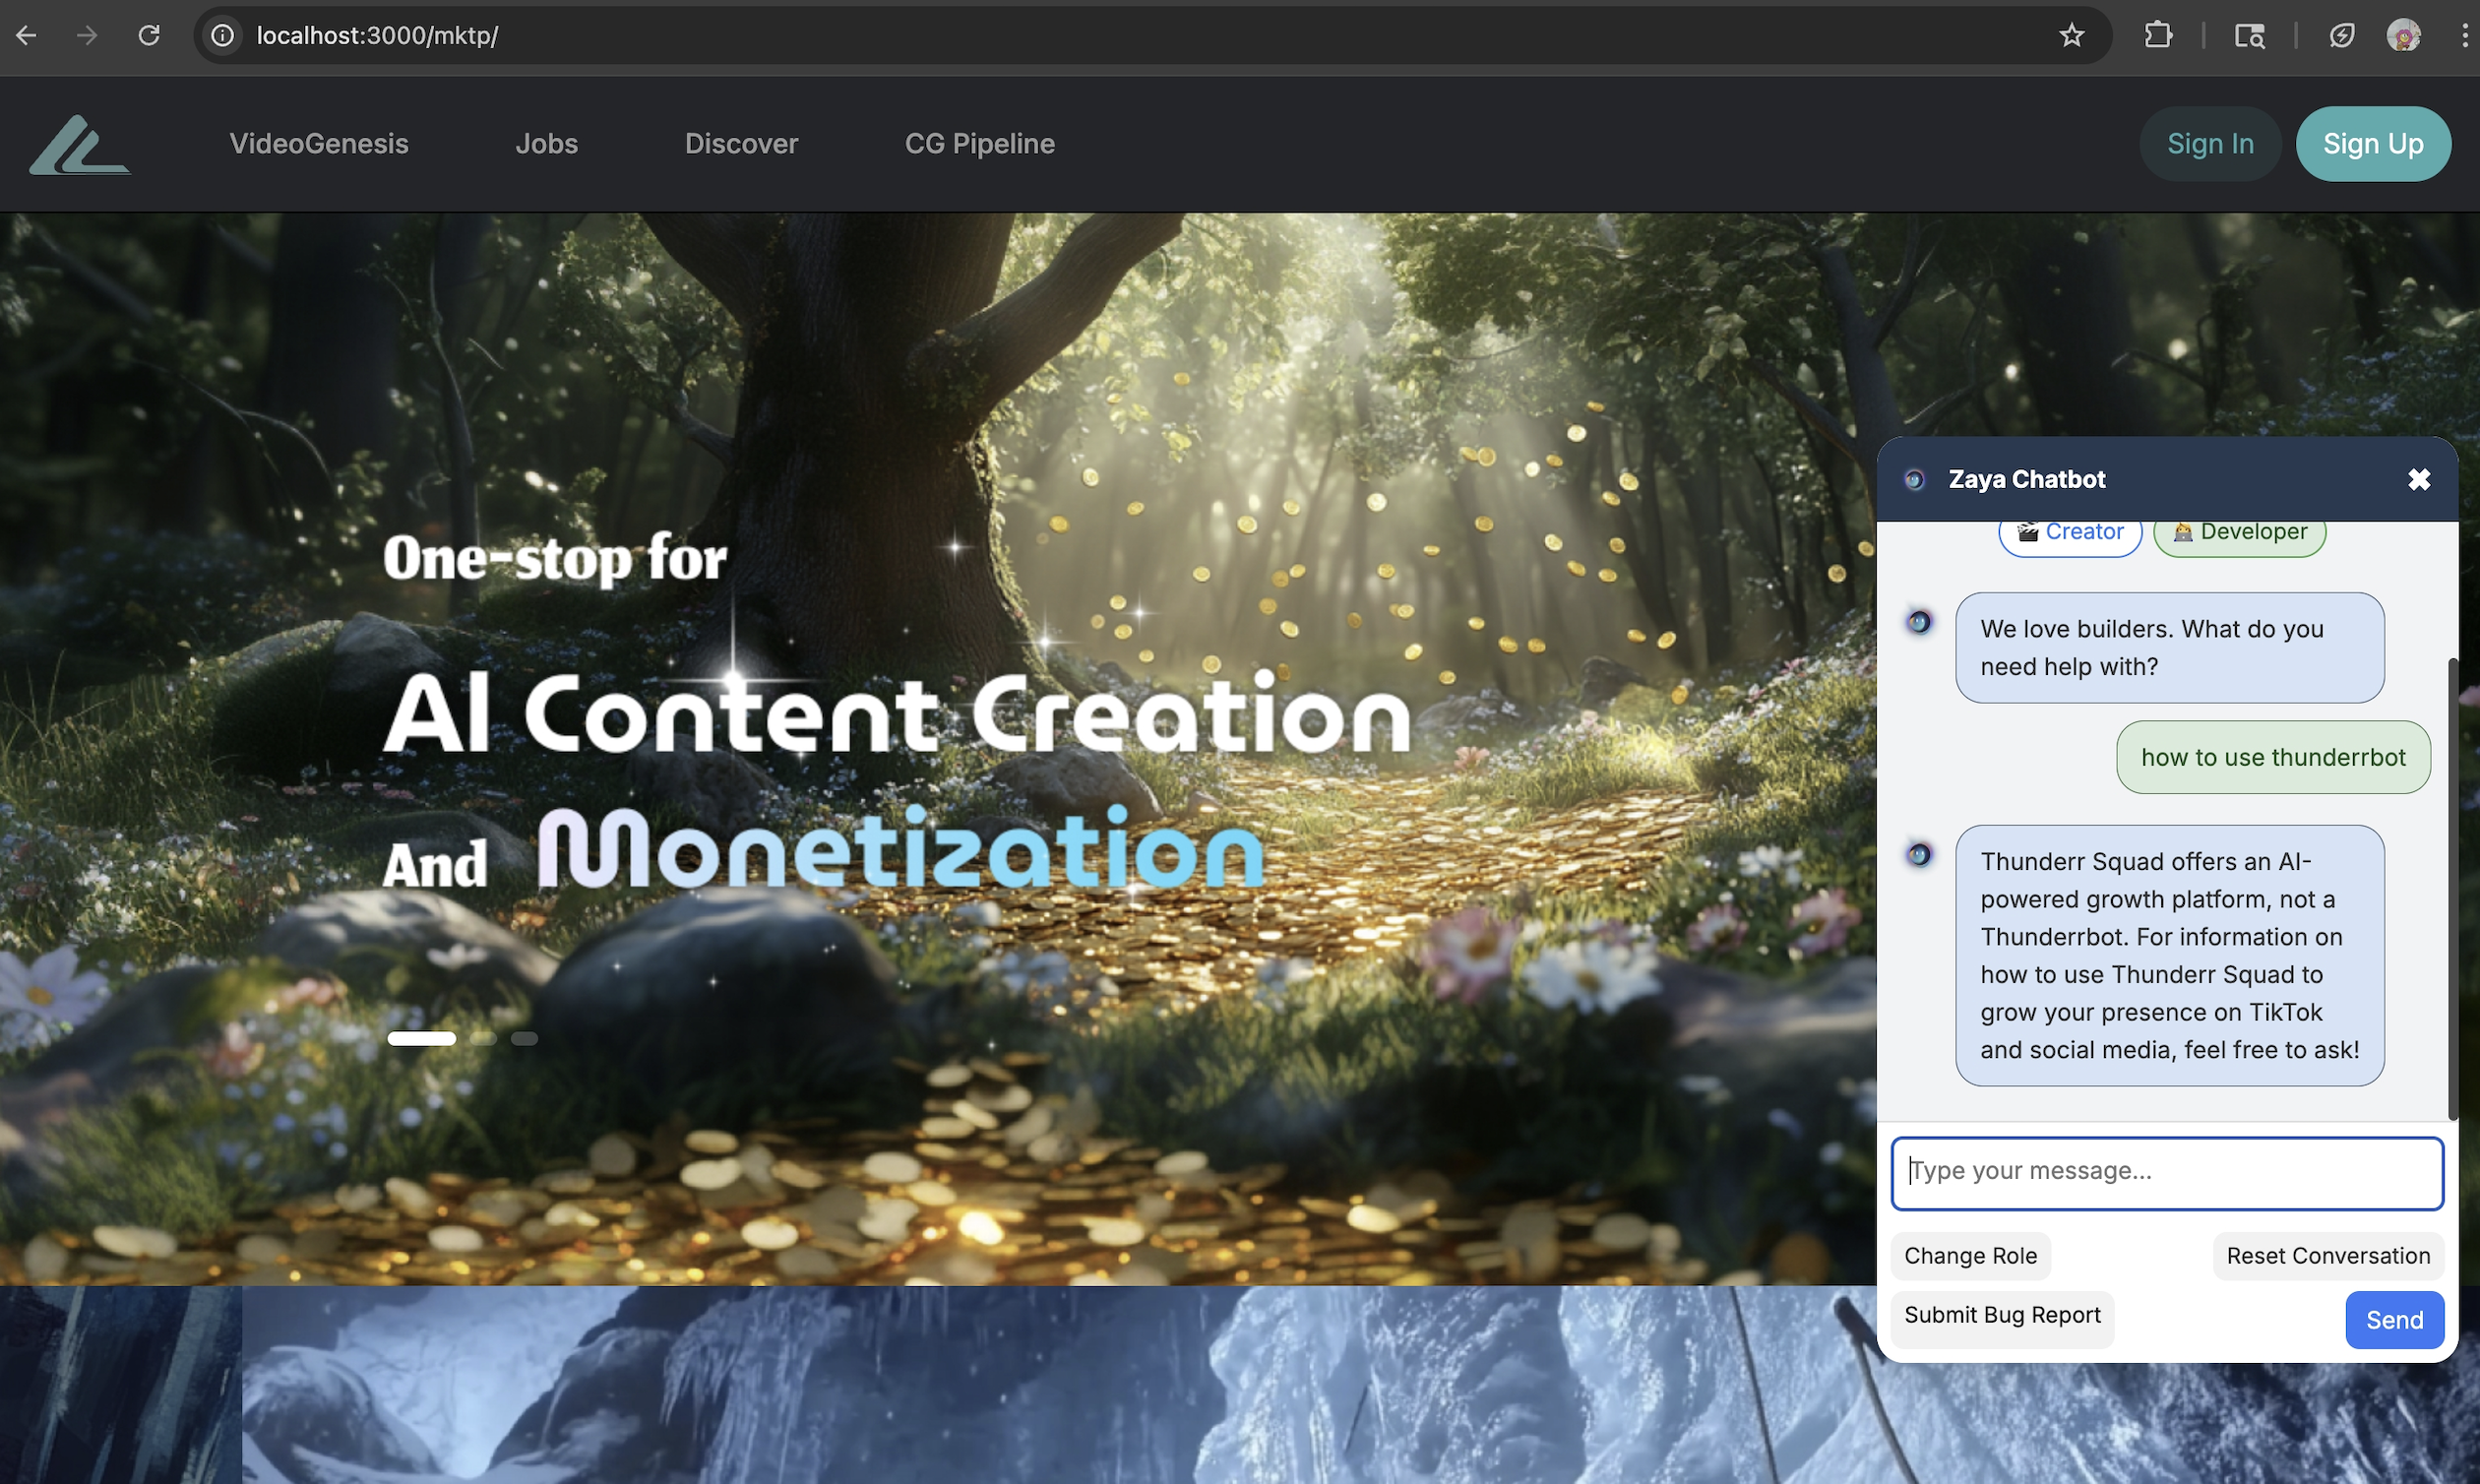
Screenshot of Zaya Chatbot

Internship project · Chatbot MVP

Zaya Chatbot

Built an embedded chatbot MVP with a React frontend, Python backend APIs, structured conversation logging, and Lark Sheets workflows for reviewing user behavior and product interactions.

React Python APIs Lark Sheets Data Logging
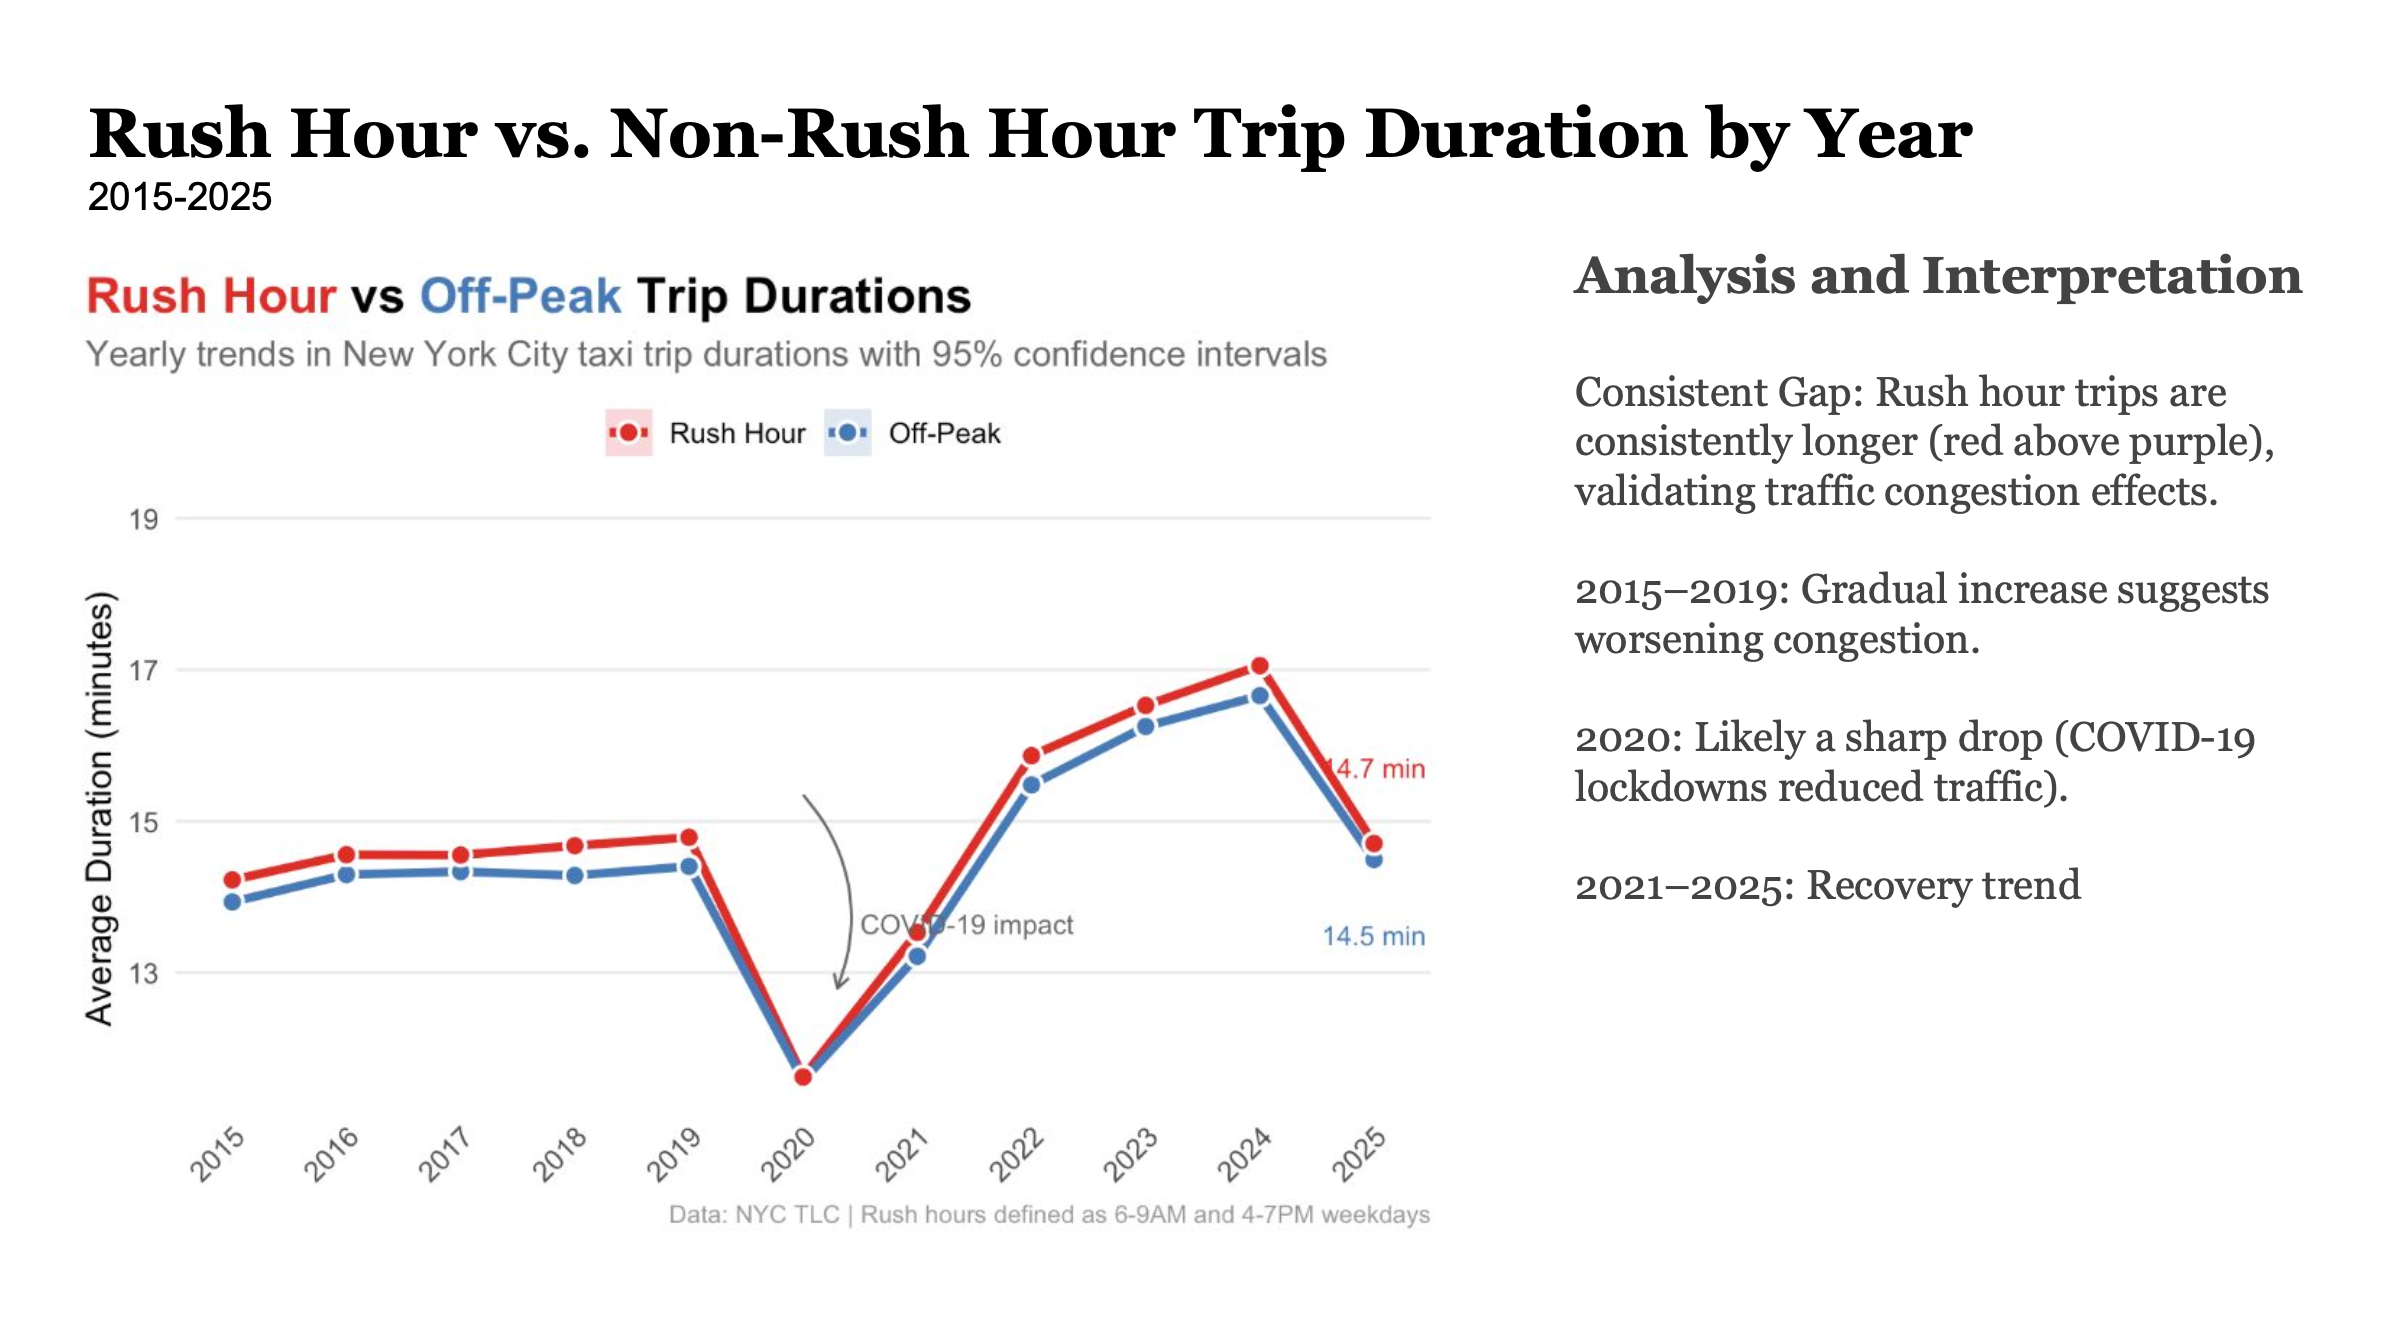
NYC Cab Activity Analysis screenshot

R · Distributed analysis

NYC Cab Activity Analysis

Analyzed around 100 million NYC taxi trips using distributed R workflows and statistical models to study COVID-era transportation changes, demand patterns, rush-hour impacts, and fare trends.

R CHTC HTCondor ggplot2 PowerPoint
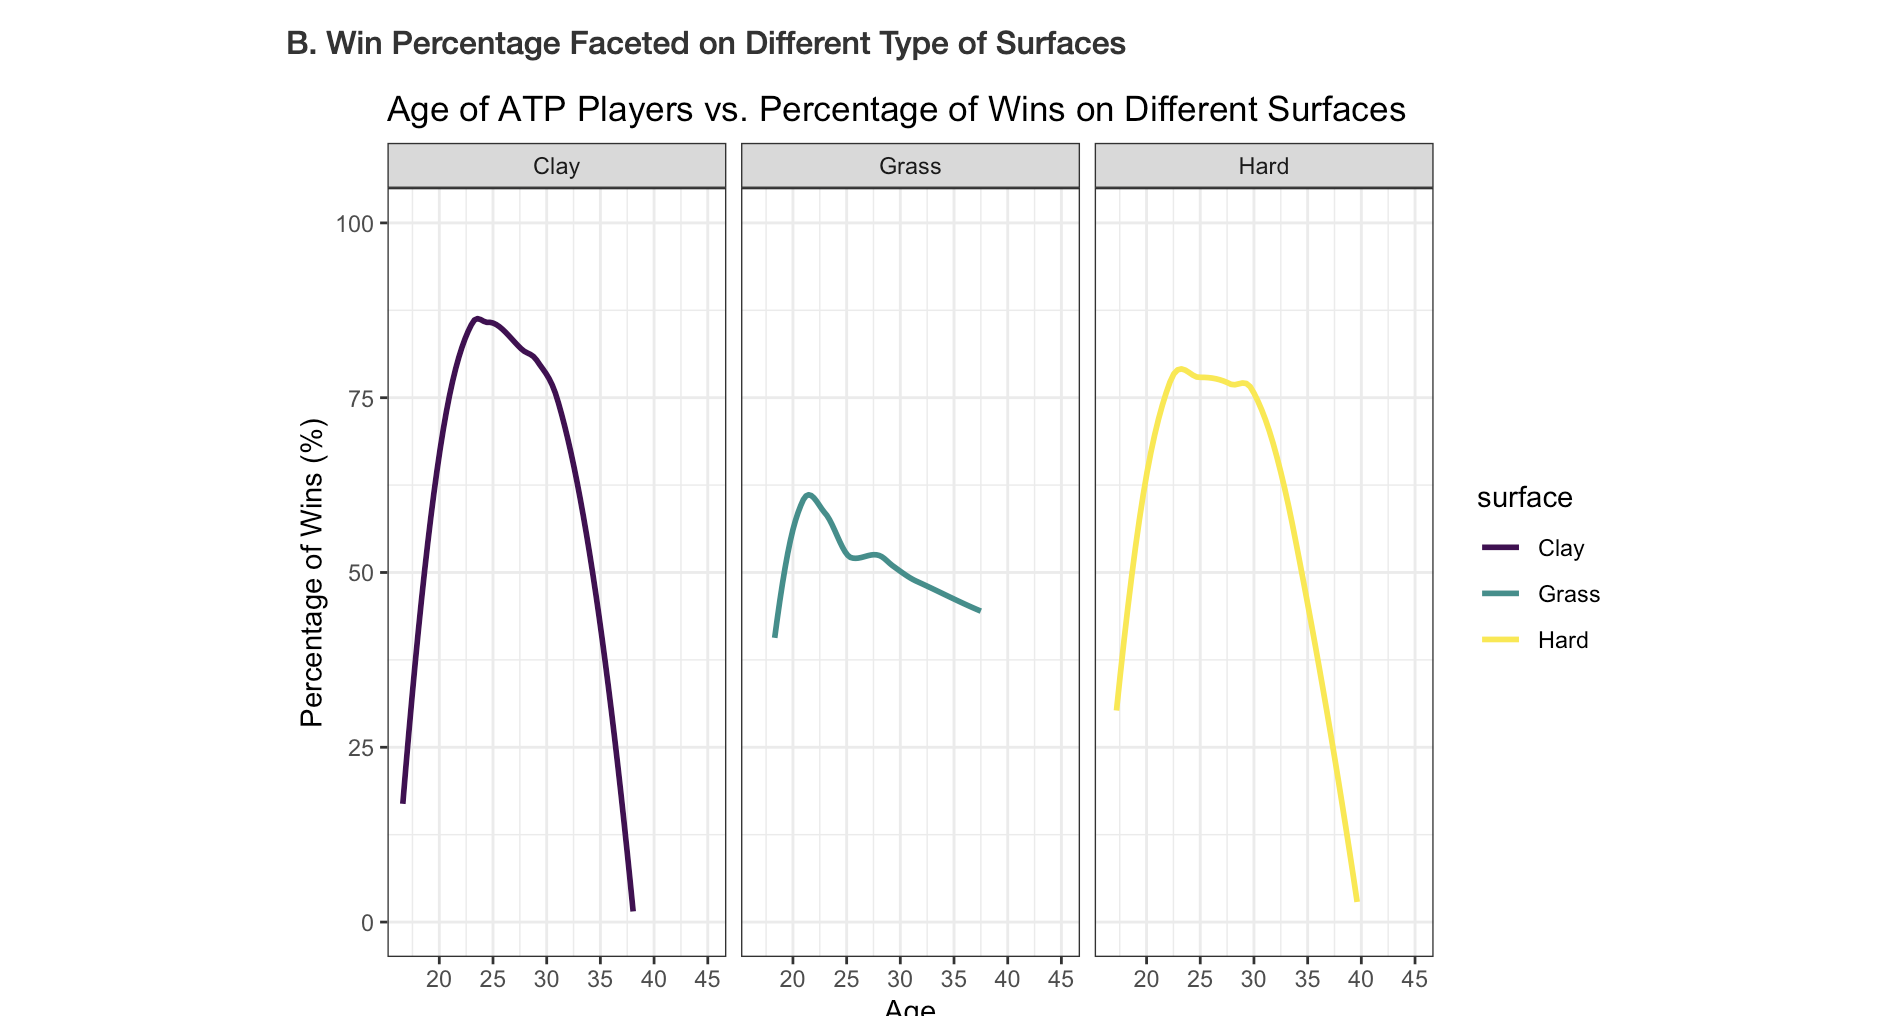
ATP and WTA analysis screenshot

R · Statistical modeling

ATP & WTA Analysis

Modeled professional tennis data to study how age, height, and court surface relate to win rates across ATP and WTA matches.

R ggplot2 Loess t-tests

Let's connect.

I'm interested in data analyst, business analyst, BI, product analytics, and technical data roles. Reach out if you'd like to talk about projects, opportunities, or collaboration.

aleeyaizzati03@gmail.com